...
Manual - Manual analysis relies on the user to assess the match between the standard cruise data and check cruise data, either via visual review of the data in the Trees/Logs table in InventoryManager or through visual or quantitative analysis of exported data.
Trees/Logs tables - to visually review data quality, click on any check cruised plot in the InventoryManager map and review the data in the Trees and Logs tables. In these tables, records are sorted by ID and there should be 2 entries for each tree or log. The second entry will be displayed using a blue font to indicate that it is a check cruise entry. Visually compare the values within each pair of entries to assess how well they match.
Export - to perform a more quantitative manual assessment, export standard and check cruise data from InventoryManager using the Export function. When exporting data, first select the stand or stands in the map, click on the Export tab, select the export config file, then select (at a minimum) the ‘Include’ option for Check Cruise Trees. Do not enable FVS or TCruise export when exporting check cruise data. In the resulting Excel file, each row will contain the pair of records, with the standard record on the left and the related check cruise record on the right. Use standard Excel functions to calculate the differences between specific fields and apply any scoring logic desired. Note that this process can produce results similar to the automated check cruise score calculation described below but is more complicated and time consuming to implement.
Automated
Check Cruise Score -
Check Cruise Score calculation uses configurable check cruise scoring rules to automatically calculate check cruise scores at the tree and plot level, and optionally store the resulting score back to the Plots layer for further review and reporting. To implement check cruise scoring, the following steps must be completed:
Data model must include the Check_Rules table and Check_Score, Check_Details, and Check_Score_Date fields.
Select the Stands for which you want to calculate Check Cruise Score, then select
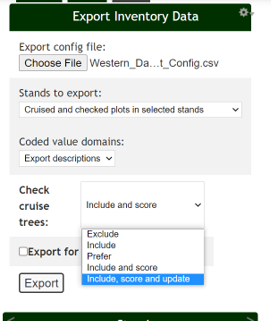
Export -using the Export function to export standard and check cruise data,select the option to ‘Include, Score and Update’ option for Check Cruise Trees.
Review the resulting export Excel file and the check cruise score that is applied to each checked plot in the selected Stand(s)
More details can be found in the “Calculate Check Cruise Score” section of https://woodlandsg.atlassian.net/wiki/spaces/MD/pages/307790025/InventoryManager+Export+Inventory+Data?parentProduct=JSM-Portal&parentProductContentContainerId=10103&initialAllowedFeatures=&locale=en-US#Calculate-Check-Cruise-Score
ArcGIS Dashboards
ArcGIS Dashboards (https://www.esri.com/en-us/arcgis/products/arcgis-dashboards ) is an out-of-the-box application available to most users via ArcGIS Online. It provides a configurable charting tool that can filter and group data, calculate statistics (min, max, average, etc.) and graphically display results using a use a range of chart types (pie charts, bar graphs, tables, etc.)
ArcGIS Dashboards can be developed to display check cruise results, including:
Percent of plots within a cruise that have been checked
Percent of plots measured by a cruiser that have been checked
Average check cruise score by cruiser
...