...
There are a wide range of data collection workflows and data models for timber inventory (cruise) data collection. In the sections below we list steps of the most common workflow as well as some alternative workflows.
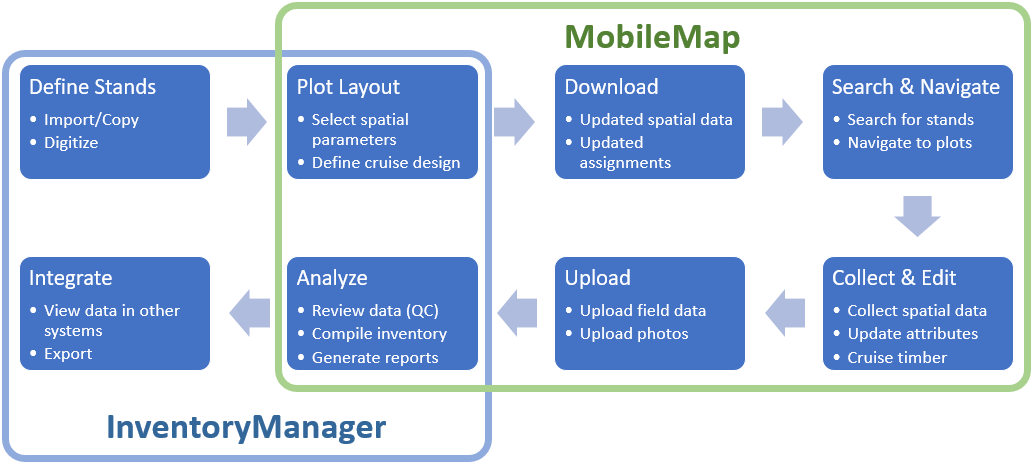
Standard Workflow
A data manager, project manager, or analyst selects or creates cruise Stands (also called cruise units, sale units, or blocks) and loads them into the cruise feature service with the appropriate default data (e.g., Stand_ID, crew, contractor name, and/or status).
There are several ways to create cruise polygons, including:
Heads-up digitize in InventoryManager. This can include creating from larger polygons using the Split tool
Copy from another layer (e.g., ‘Source_Stands’, ‘LRM_Planned_Activities’) in InventoryManager using the Copy tool
Import from Shapefile in InventoryManager using the Import tool
Create in ArcGIS Pro. Note that key fields like Unique_ID must be populated if using this approach.
A data manager, project manager, or analyst creates cruise-plot point features using their preferred methodology and saved these plots to the feature service with the appropriate default values (e.g., Plot ID, status, etc.), or field users determine the location and type of plot while in the field.
There are several ways to create Plots, including:
Plot layout tool in inventoryManager (InventoryManger: Plot Layout )
3rd Party plot layout tools (e.g., LandMark Spatial Solution’s EZ Plot)
Custom GIS process (e.g., Python script in ArcGIS Pro). Note that key fields like Unique_ID, Parent_ID and Plot_ID must be populated if using this approach.
Before heading into the field, the cruiser connects their device to Wi-Fi and downloads Stands and Plots, and uses query and identify tools to determine where they should work.
Cruiser can download ALL Stands and Plots or a subset of Stands and Plots that have been ‘assigned’ to them. Assignment can mean that they are accessing a Feature Service that only contains data that that they or their organization should cruise, that they have used a download filters to download a subset of data (MobileMap: Edit Download Parameters)
Cruiser selects the Edit Tool, the Plots layer, then taps on the first Plot they want to measure. They use the visual navigation aids (navigation line, distance and direction values, GPS location and direction icons) to travel to that Plot (MobileMap: Field Navigation). MobileMap plays a notification sound and opens the plot in edit mode when they arrive (navigate within the distance threshold set in the proximity alert settings).
Cruiser opens up the tree form, records all ‘in’ trees, then closes the tree form.
Cruiser selects the next plot (identify tool) and uses navigation tools to travel to that plot.
Cruiser returns from the field to a Wi-Fi connection and they uploads their data. They also download any new stands/plots to be cruised the next time the go into the field.
If appropriate, Cruiser reviews there uploaded data in InventoryManager to verify that all data were successfully uploaded, that all measured plots have been updated, and that all plot and tree values are correct.
A data manager, project manager, analyst reviews the progress of cruise in InventoryManager.
...